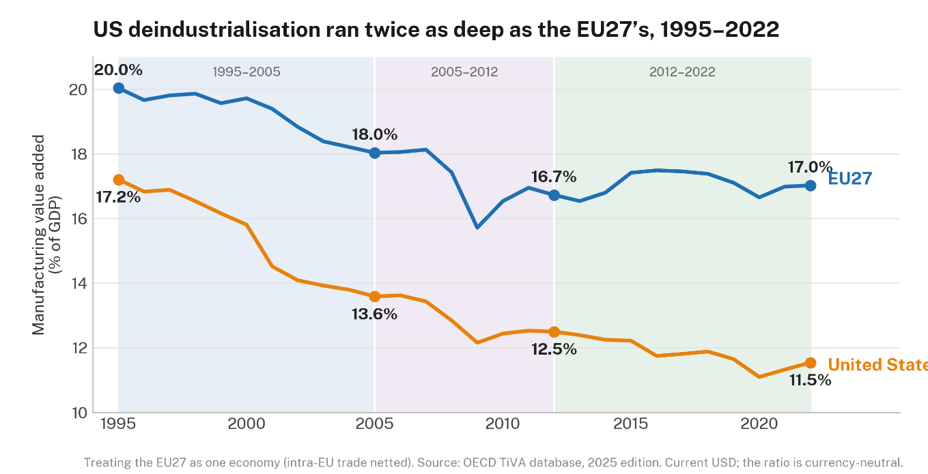
Despite the prevailing narrative of Western deindustrialisation as one of a rigid Europe and a dynamic America, Richard Baldwin, Saul Estrin, and Bob Hancké argue that the comparison of the EU with the US turns this narrative on its head. While both have experienced deindustrialisation, it has been for different reasons and with the US’s running deeper.
The familiar story of deindustrialisation says Europe is over-regulated, over-taxed and burdened by ageing factories, while the United States is dynamic and high-tech. Yet the data tells a different story. Between 1995 and 2022, manufacturing as a share of GDP fell by 5.7 percentage points in the US, but by only 3.0 points in the EU27.
In other words, America out-deindustrialised Europe. The important question is not simply who lost more manufacturing, but how exactly that happened. A closer look shows that the two economies reached deindustrialisation by very different routes.
Three stories of deindustrialisation
Deindustrialisation can be broken down into three elements. The first is the slice: how much domestic value is retained from each euro of manufactured output after imported inputs are paid for. The second is trade: the share of manufacturing expenditure spent on imports. The third is demand: whether spending shifts from manufactured goods towards services.
Put simply, an economy can lose manufacturing share because people buy fewer manufactured goods, because they switch to imports, or because producers retain less value from what they make. These channels reveal sharply different stories for the US and Europe.
America’s demand story, Europe’s slice story
For the US, the main driver was domestic demand. Americans shifted a large share of spending away from manufactured goods and towards services. This demand channel accounted for 5.4 percentage points of the fall in manufacturing’s share of GDP. Rising import penetration added another 1.7 points, while the domestic value-added slice moved in the opposite direction.
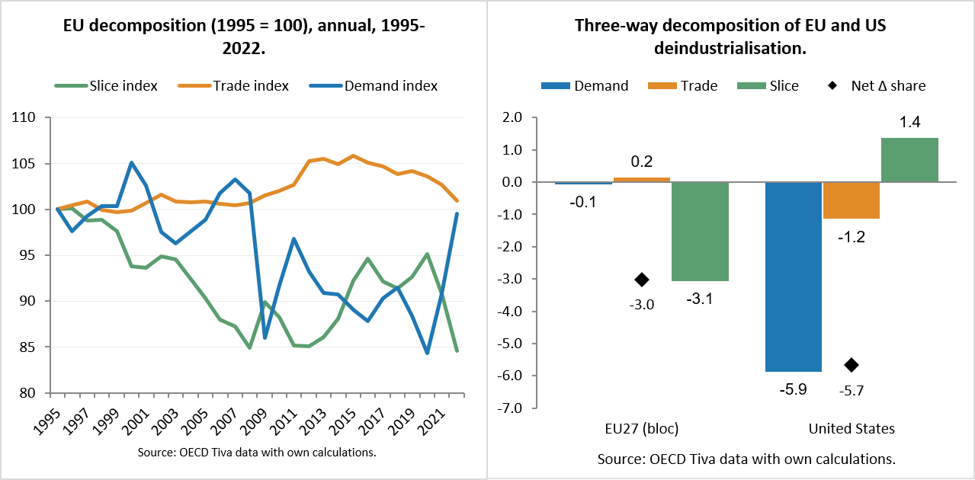
Europe’s experience was almost the photographic negative. Demand for manufactured goods barely moved, as declining demand in Western Europe was offset by rising demand in Central and Eastern Europe. Trade was not the main culprit either: the EU27 maintained a healthy manufacturing surplus with the rest of the world. Almost the entire three-point decline came from the slice. European factories were producing, and Europeans were still buying, but less value added was retained within European manufacturing.
That distinction matters. If deindustrialisation is driven by weak demand or import competition, the policy response is different from one in which firms are squeezed by input costs, energy prices or fragmented supply chains.
Europe’s three phases
The EU27 story unfolded in three phases. From 1995 to 2005, manufacturing’s share of GDP fell from 20.0% to 18.0%. This was the decade of the “second unbundling”, when digital technologies made it easier for firms to move production stages abroad while keeping knowledge, design and management at home.
It was also the decade of EU enlargement. In 2004, ten new members joined the Single Market, many of them lower-wage economies by Western European standards. Firms in Germany, France, Italy and elsewhere increasingly routed production eastwards. Manufacturing was being reorganised inside Europe, not simply lost from it.
The second phase, from 2005 to 2012, was shaped by the financial crisis. Demand turned sharply negative as Europeans bought fewer manufactured goods, while the slice continued to erode. A growing trade surplus cushioned the damage but did not reverse the decline.
From 2012 to 2022, manufacturing recovered modestly. Demand improved and the slice stabilised, but the earlier trade tailwind weakened as energy and intermediate-goods imports grew faster than exports. The 2022 energy shock following Russia’s invasion of Ukraine exposed Europe’s sensitivity to production costs.
Sectors: chemicals and cars held up best
The sectoral picture adds nuance. In the OECD TiVA data, only two broad manufacturing sub-sectors increased their share: chemicals, pharmaceuticals and refining; and transport equipment. Both remained strong exporters. Pharmaceuticals benefited from a demand boom, while transport equipment, especially cars, continued to generate large surpluses.
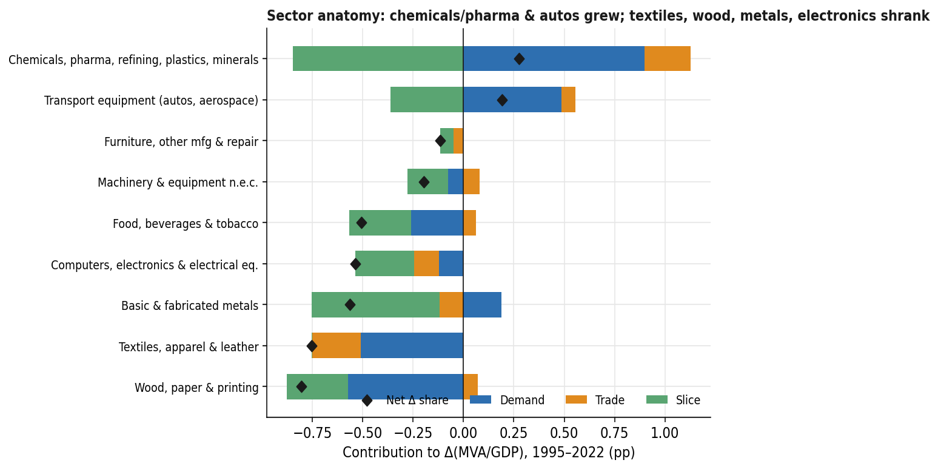
Elsewhere, the causes differed. Textiles and apparel fit the classic import-competition story, as Europeans increasingly bought from Asia. Metals declined mainly because of the slice, suggesting pressure from energy and input costs rather than simply weak demand or foreign competition. If the problem is the domestic cost base, border measures alone will not fix it.
Two sectors deserve particular attention. Metals are central to the EU’s Carbon Border Adjustment Mechanism, designed to protect firms from carbon-intensive imports. Yet the data suggest Europe’s own energy bill may have been the more immediate problem. Cars face a different threat: cheap, competitive Chinese electric vehicles, largely after the 1995–2022 period covered here.
Countries: one Europe, several stories
The EU27 average also hides very different national experiences. Some legacy industrial economies, including France, Belgium, Sweden and Finland, lost substantial manufacturing share in a more American-style, demand-led pattern. Germany and Italy were partial exceptions: Germany’s strong demand and trade position almost offset a steep decline in its slice.
Central Europe tells a different story. Poland, Czechia, Hungary and Slovakia became part of a European factory belt, absorbing production stages from the older industrial core. Their demand for manufactured goods grew strongly, but their value-added slice fell as they became more deeply integrated into German-led supply chains.
This is the logic of “Factory Europe”: products may be branded, designed or engineered in one country, while their value chains stretch across several others. That helped Europe avoid the trade-driven deindustrialisation seen in the US, but it also redistributed value within the continent.
Ireland is a special case. Its measured manufacturing share rose from 22% to 39%, largely because US pharmaceutical and tech multinationals shifted intellectual property and production onto the Irish balance sheet for tax reasons. Ireland alone added roughly 1.1 percentage points to the EU27 headline number; without it, Europe’s decline is closer to 3.8 points than 3.0.
What this means for industrial policy
Since 2025, the EU has embarked on its most ambitious turn towards industrial policy in decades. The Draghi Report’s warning about Europe’s competitiveness gap has helped push Brussels from referee to promoter, with measures including the Clean Industrial Deal, “Made in Europe” procurement rules and support for steel, chemicals, batteries and semiconductors.
The evidence suggests that some of this agenda is well targeted, but some may be aimed at the wrong problem. Measures that reduce energy costs, support productivity and help firms retain more value added speak directly to Europe’s main weakness: the shrinking slice. Policies focused mainly on tariffs, procurement preferences or import defences address a channel that, in aggregate, was not the main source of Europe’s decline.
That does not mean trade threats are irrelevant. Chinese electric vehicles, energy-intensive imports and geopolitical risks all pose real challenges. But from 1995 to 2022, Europe was not hollowed out because consumers abandoned manufactured goods or imports overwhelmed domestic producers. Its deeper problem was that manufacturing retained less value.
The comparison with the US therefore turns the standard narrative on its head. The supposedly dynamic economy shed manufacturing share faster, largely because its consumers moved more decisively towards services. The supposedly sclerotic economy held on to manufacturing demand and maintained a trade surplus, but lost value through thinner margins, cost pressures and more complex supply chains.
Europe did deindustrialise, but not in the way many assume. If the aim is to strengthen European manufacturing, the priority should be to increase the value captured by firms and workers in Europe: through cheaper and cleaner energy, stronger productivity, more resilient supply chains and sectors where Europe can still command global demand.
- This blog post represents the views of its author(s), not the position of the London School of Economics and Political Science Department of Management.
- The full post on which this blog is based can be found on the authors’ Substack.
- Read Saul Estrin’s other recent blog.
- Original cover image from Pexels.
The post How America out-deindustrialised Europe first appeared on LSE Management.